
How to Navigate Fears of a Market Bubble
- Nate Baim, MBA, CFP®

- Sep 23, 2025
- 7 min read

As markets reach new highs and artificial intelligence stocks continue to rally, some investors are asking "are we in a bubble?" This is as much about investor psychology as it is about market conditions. While it’s normal to worry about bubbles, focusing too much on them can lead to counterproductive portfolio decisions that prioritize timing and short-term trading rather than long-term financial goals.
The concept of a “bubble” is often taken for granted when we talk about financial markets, but it’s actually quite hard to define what the term means. Markets naturally experience cycles, and how investors perceive risk changes over time. For every example of a bubble - including the late 1990s dot-com era and the mid-2000s housing boom - there are countless other situations when investor concerns never materialized. For example, investors constantly worried about additional bubbles after the 2008 financial crisis, only for this period to become the longest bull market on record.
So, the question of whether there is a bubble should be distinguished from "will the stock market experience a setback?" As investors know from the past several years, short-term stock market declines are normal and can occur without notice. Just earlier this year, the S&P 500 declined 19% but bounced back in less than three months. Many who tried to time the market during this period likely found themselves on the sidelines as the market recovered.
While the past is no guarantee of the future, the stock market has made significant gains over history despite periodic challenges. In this uncertain environment, how can investors stay focused on building portfolios aligned to their financial plans?
Valuations are high but there are important factors to keep in mind
To distinguish between short-term pullbacks and the fear of a potential bubble, it's important to consider the concept of value. As with everything in life, what matters in investing isn't just what price you pay but what you get for your money. After all, the reason investors buy stocks is to own a part of a business and its cash flows. Valuation metrics such as price-to-sales or price-to-earnings tell us not just the price of a share, but what we're getting for that price.
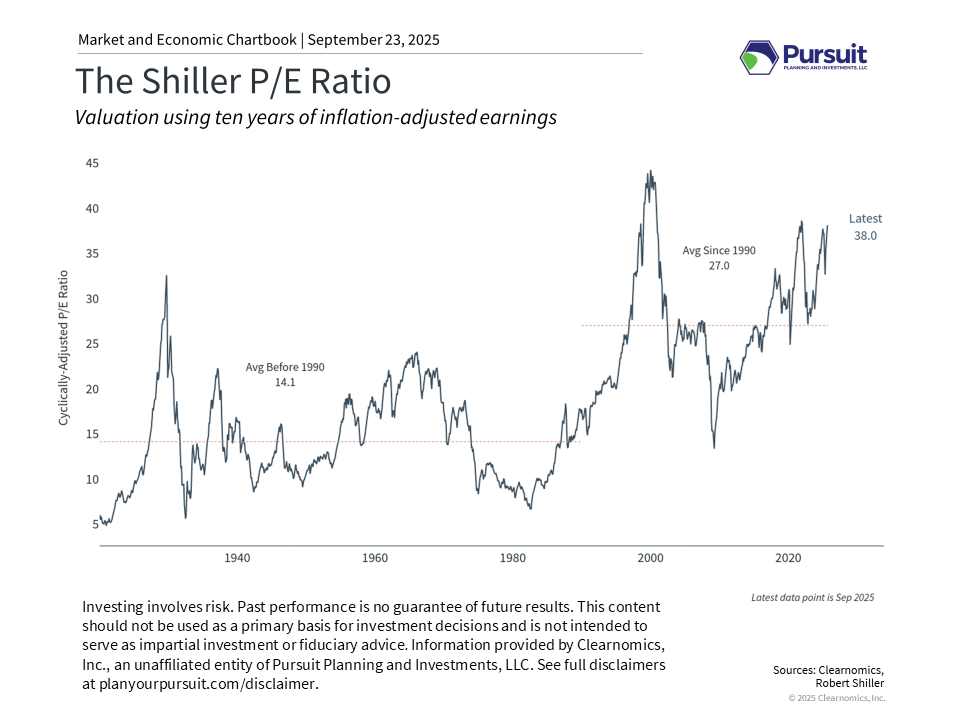
The accompanying chart shows the Shiller price-to-earnings ratio which provides perspective on long-term valuation trends by using inflation-adjusted earnings over the past ten years. The current level of 38x, which means that investors are paying $38 for each dollar of historical earnings today, is well above the average of 27x. This has fluctuated over the past few years as markets have navigated inflation, policy uncertainty, and volatility in technology stocks.
With many measures showing that the stock market is expensive by historical standards, there are a few key points for investors to keep in mind. First, it's important to emphasize that valuations do not reliably predict stock market returns in the near term. Instead, they tell us how much investors are willing to pay based on their expectations about the future. Even when stocks appear expensive, markets can continue rising for months or years if business fundamentals remain strong. This is why trying to time the market can often be counterproductive.
Second, while there are parallels to the 1990s tech boom since both periods feature high valuations and excitement around new technologies, there are some key differences. Unlike the unprofitable dot-com companies of the past, current market leaders are well established, have strong profitability, and healthy balance sheets. Just as the information technology revolution ultimately benefited all types of companies over the past few decades, so too could developments in artificial intelligence.
Third, not all bubbles “pop.” While valuations can come back to Earth if prices fall, they can also improve if earnings and other fundamentals remain strong. Some of the enthusiasm experienced by the market today is in anticipation of higher future earnings. Corporate performance has justified some of these expectations in recent quarters with earnings growth coming in stronger than many had anticipated.
Opportunities exist across a range of styles and sizes
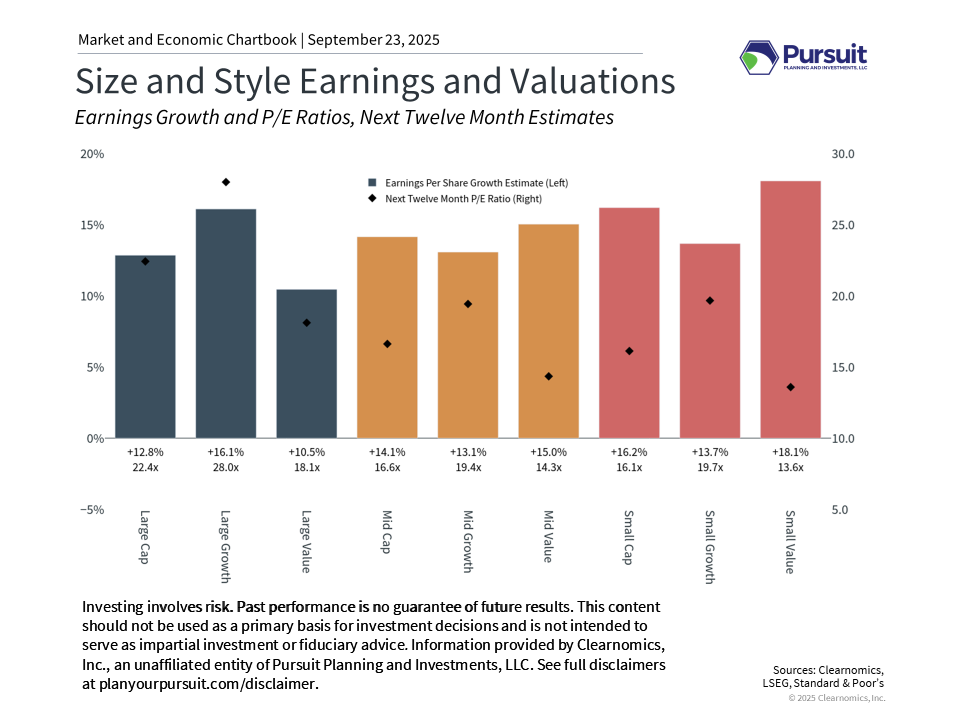
Today, the question isn't whether AI will matter, but whether current valuations are reasonable. With the overall S&P 500 trading at a 22.5x price-to-earnings ratio, one that is approaching the all-time high of 24.5x, investors are paying a premium that assumes these trends will continue at the same pace.
While valuations for the broad market are elevated, there are other areas that are more attractive. As the accompanying chart above shows, the price-to-earnings ratio for Large Cap Growth stocks is the highest at 28x. Other stock market sizes and styles, including Large Value and Small Caps, have more attractive valuations, even as they continue to experience healthy earnings growth.
This is true across stock market sectors as well. Artificial intelligence-related companies are primarily concentrated in the Information Technology, Communication Services, and Consumer Discretionary sectors. In recent quarters, positive trends have broadened to other sectors with more attractive valuations too, including Financials, Industrials, and more.
For investors, including a range of sizes, styles, and sectors in a portfolio not only helps reduce “concentration risk,” but can improve the overall valuations of holdings to better manage risk. It’s difficult to predict exactly which areas of the market will outperform over any given period, so holding an appropriate mix can help to improve portfolio balance.
Time remains one of the most powerful investment tools

Perhaps the most important lesson from market history is that time tends to reward patient investors, even those who invest throughout periods of high valuations. As the chart above shows, some of the most impactful market events appear less dramatic when zooming out over years and decades - time horizons that are appropriate for many investors’ financial goals. For instance, the tech and housing bubbles, while challenging at the time, both experienced recoveries as the market rose to new all-time highs.
This emphasizes the importance of not only portfolio positioning, but investment concepts that take advantage of longer timeframes such as dollar cost averaging. Even those who invested at the worst points in history, such as the 1929 market peak before the Great Depression, achieved positive returns over time. Starting during lower valuations generally produces better returns, but this advantage diminishes over extended time horizons.
Concerns over a “bubble” have grown as the market continues to reach new all-time highs, and technology stocks continue to grow in importance. Rather than focusing on what this means for the market in the short run, investors should consider historical lessons and how they impact long-term portfolios.
The bottom line? Today's market valuations are high in large part to strong earnings and business fundamentals. The key is maintaining a diversified portfolio that can benefit from growth while managing risk, something best done with professional guidance.
Looking for a financial planner? Schedule a complimentary consultation through my website and take the first step toward greater clarity and alignment in your financial life.
Have something on your mind?

Pursuit Planning and Investments, LLC (“PPI”) is a registered investment advisor offering advisory services in the States of Oregon, Indiana, and in other jurisdictions where exempted. Registration does not imply a certain level of skill or training. All views, expressions, and opinions included in this communication are subject to change. This communication is not intended as an offer or solicitation to buy, hold or sell any financial instrument or investment advisory services. Any information provided has been obtained from sources considered reliable, but we do not guarantee the accuracy or the completeness of any description of securities, markets or developments mentioned. We may, from time to time, have a position in the securities mentioned and may execute transactions that may not be consistent with this communication's conclusions. Past results do not guarantee future results. Please contact us at 971-803-5948 if there is any change in your financial situation, needs, goals or objectives, or if you wish to initiate any restrictions on the management of the account or modify existing restrictions. Additionally, we recommend you compare any account reports from PPI with the account statements from your Custodian. Please notify us if you do not receive statements from your Custodian on at least a quarterly basis. Our current disclosure brochure, Form ADV Part 2, is available for your review upon request, and on our website, www.planyourpursuit.com. This disclosure brochure, or a summary of material changes made, is also provided to our clients on an annual basis.
This communication is for informational purposes only and is not intended as tax, accounting or legal advice, as an offer or solicitation of an offer to buy or sell, or as an endorsement of any company, security, fund, or other securities or non-securities offering. This communication should not be relied upon as the sole factor in an investment making decision.
Past performance is no indication of future results. Investment in securities involves significant risk and has the potential for partial or complete loss of funds invested. It should not be assumed that any recommendations made will be profitable or equal the performance noted in this publication.
The information herein is provided “AS IS” and without warranties of any kind either express or implied. To the fullest extent permissible pursuant to applicable laws, Pursuit Planning and Investments, LLC (referred to as “PPI”) disclaims all warranties, express or implied, including, but not limited to, implied warranties of merchantability, non-infringement, and suitability for a particular purpose.
All opinions and estimates constitute PPI’s judgement as of the date of this communication and are subject to change without notice. PPI does not warrant that the information will be free from error. The information should not be relied upon for purposes of transacting securities or other investments. Your use of the information is at your sole risk. Under no circumstances shall PPI be liable for any direct, indirect, special or consequential damages that result from the use of, or the inability to use, the information provided herein, even if PPI or a PPI authorized representative has been advised of the possibility of such damages. Information contained herein should not be considered a solicitation to buy, an offer to sell, or a recommendation of any security in any jurisdiction where such offer, solicitation, or recommendation would be unlawful or unauthorized.


Comments